Part III — Patent Quality and Value Rankings to Complement Quantity-Based Intelligence
Actionable analytics must clearly answer the questions that decision-makers have in mind: what they need is objective information rather than vague assumptions. However, as we saw above, some of the indicators traditionally used are a mere aggregation of data relating to the inventor’s expertise and the patent’s novelty, breadth of rights, and other criteria. As such, they can’t be regarded as valuable insights since they don’t provide any information on why the patent is graded as high-value.
Apart from the general patent value grades mentioned above, another frequently-used indicator is the number of patents in a portfolio.
However, the same patent or group of patents may have different value to different stakeholders: the mere practice of counting them is simply not enough.
While maintaining the simplicity of quantity-based patent intelligence, Patentcloud’s Patent Quality and Value Rankings can function as an effective filter to sort the signal from the noise, especially considered the overwhelming number of patent applications filed each year.
Scenario 1: Patent Landscape in Competitive Benchmarking
Patent landscapes are used in competitive benchmarking to identify the major applicants or patent owners in a given technology field.
A conventional listing may include “poor value” patents, many of which may have never been practiced or have even been abandoned: the more patents of this kind an applicant or patent owner has, the higher the possibility of overestimating its technological strength.
Apart from these false-positive issues, there could also be false-negative issues, wherein the major high-value patent applicants or patent owners end up being overlooked simply because buried in the overwhelmingly large number of patents.
Using the Patent Value Ranking to analyze patent landscape charts can help in this scenario: filtering out D-ranked patents from the original landscape is a way to address the false-positive issues.
Similarly, by identifying A/AA/AAA-ranked patents, we can obtain a valuable reference for validating the false-negative patents.
Let’s try to identify the major players in the AMOLED patent field. The table below, created with data collected by Patentcloud, provides an overview of the top 20 applicants:
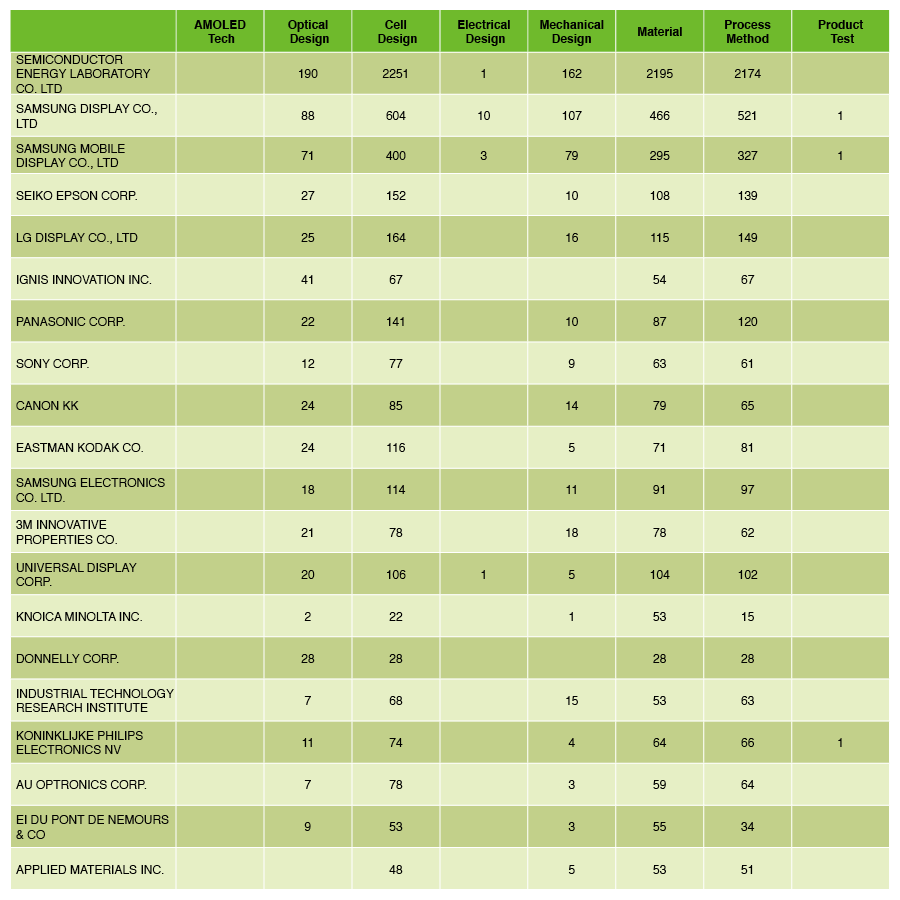
One might assume that the table offers an overview of the major players in the AMOLED technology field. However, once we remove 3,820 D-ranked patents, we obtain a substantially different list:
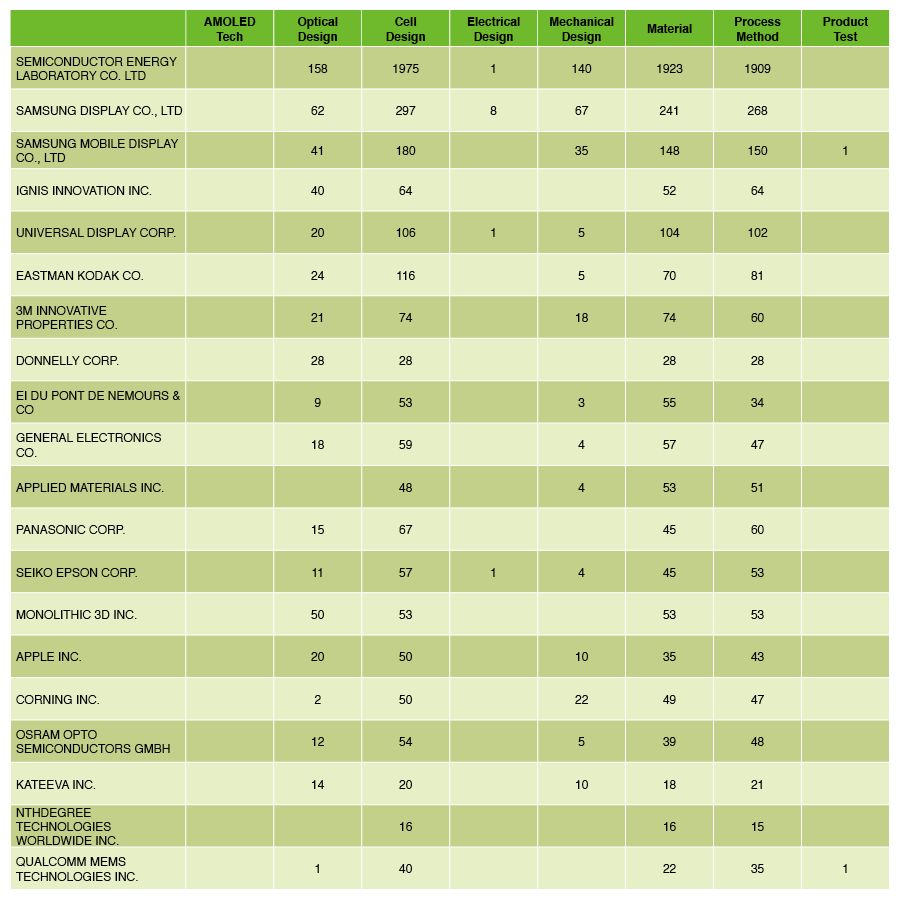
New candidates such as GENERAL ELECTRIC, MONOLITHIC 3D, APPLE, CORNING, OSRAM OPTO SEMICONDUCTORS, KATEEVA, NTHDEGREE TECHNOLOGIES, and QUALCOMM MEMS have replaced LG DISPLAY, SAMSUNG ELECTRONICS, CANON, KONICA MINOLTA, ITRI, PHILIPS, and AUO.
The new listing is more likely to include the actual major players since these applicants — according to the definition of Patent Value Ranking — may own more patents that are likely to be practiced or monetized.
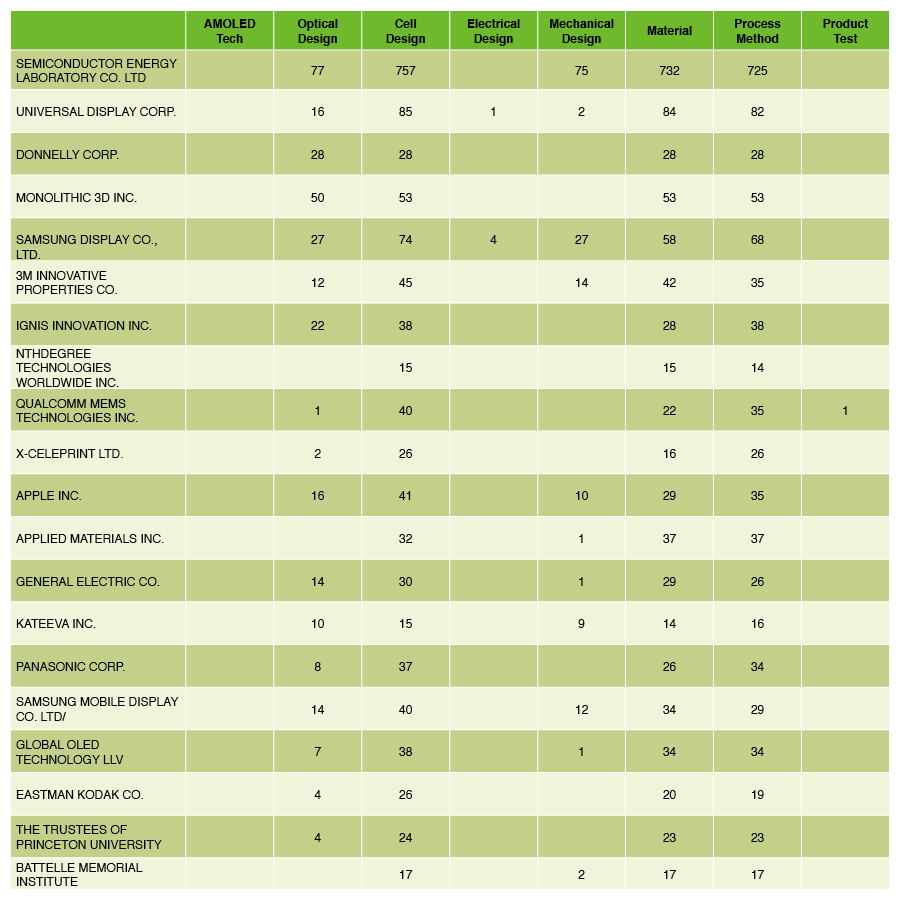
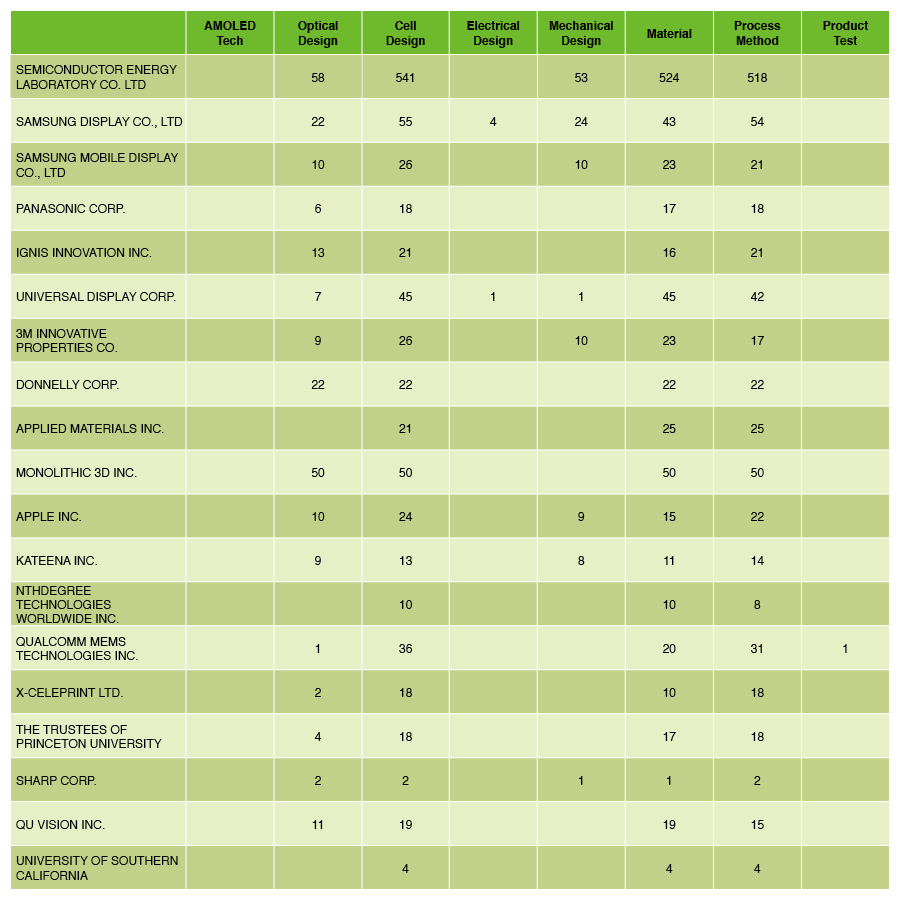
Focusing on the top applicants could complement the previous approaches: setting the filters to show patents ranked above A or AA will result in a list of applicants with more valuable patents in terms of practicing/monetizing potential: X-CELEPRINT, THE TRUSTEES OF PRINCETON UNIVERSITY, GLOBAL OLED TECHNOLOGY, BATTELLE MEMORIAL INSTITUTE, SHARP, QD VISION, and THE UNIVERSITY OF SOUTHERN CALIFORNIA step into the game:
The rankings can also be combined with priority dates to screen out relatively new entrants in the field: as we set the priority date within 5 years and the Patent Value Ranking filter on B or above, we obtain a list with additional applicants such as GUARDIAN INDUSTRIES and LUXVUE TECHNOLOGY:
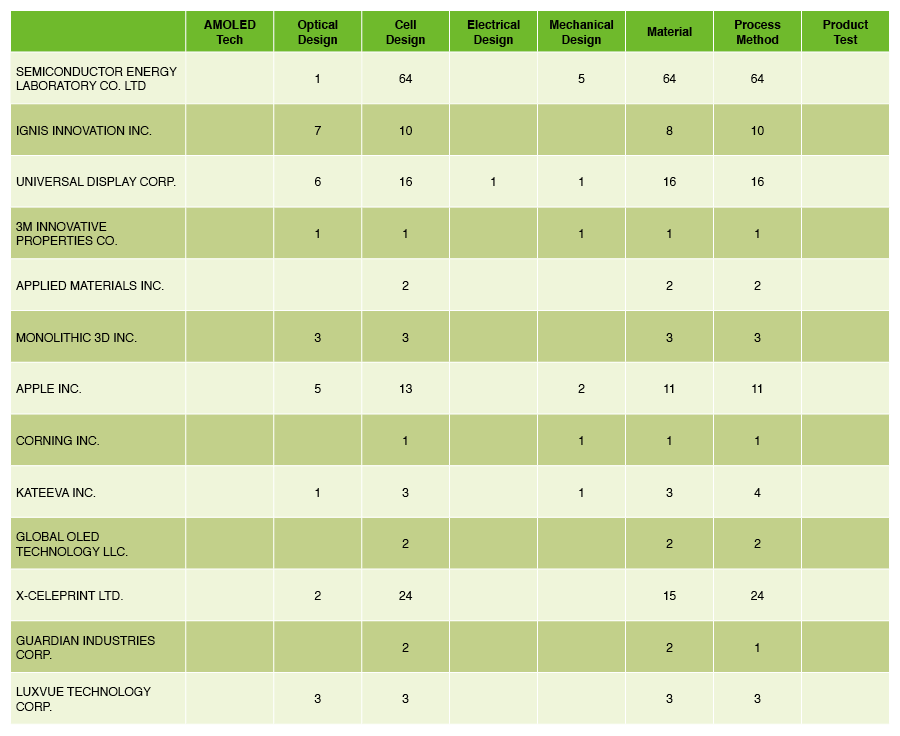
By leveraging the Patent Quality and Value Rankings we could successfully identify the key players in the AMOLED technology field and narrow down the pool of patents for a preliminary review.
Download our white paper Patent Quality and Value Rankings to discover how the Patent Quality and Value Rankings work in detail.

