Table of contents
- Introduction
- Starting with SEP OmniLytics
- Top declarers — Who is leading the 5G SEP race?
- Global coverage — Where and how are SEPs deployed?
- Working groups – Who has been declaring what?
- Remaining life – How sustainable is a SEP holder’s patent portfolio?
- Technical specifications – Who are the specialized leaders in each technology?
Note: The term “SEP” used in SEP OmniLytics and mentioned in this article refers to standard essential patents declared under 3GPP standards in the ETSI IPR declaration database.
Introduction
5G technology’s revolutionary network performance has ushered in the new industrial revolution of the Internet of Things (IoT). This indicates that network technology and patent issues are no longer limited to the telecommunication industry bringing new development opportunities, and also new challenges for all industries.
3GPP started to develop and announce 5G-related technical standards in 2016. The industry generally refers to the declarations submitted by major stakeholders to the ETSI Declaration IPR Database when identifying standard essential patents (SEPs) linked to 3GPP standards.
However, it is quite frustrating for anyone searching for declaration data in ETSI’s database. The official website has only very basic search functions and lacks data standardization. Besides, the data cannot be directly linked to the corresponding full-text patent and relevant bibliographic data.
In current circumstances, the consolidation of ETSI declaration data by major third-party data companies is also quite unsatisfactory. To obtain ETSI SEP data that can be further analyzed, a business must invest much time and labor to filter for valid and usable data — both inefficient and far from accurate.
Patentcloud’s SEP OmniLytics is purposed to alleviate the issues mentioned above. SEP OmniLytics integrates ETSI’s declaration data with patent databases from patent offices around the world. Patentcloud’s Data Science Team ensures the quality of the data by curating, cleansing, standardizing, ware-housing, and verifying all of the data before presenting them to our users with an easy-to-read interface.
In this article, we will show you how to use the five crucial charts in SEP OmniLytics to find the insights you need in the 5G SEP industry with just a few clicks.
Starting with SEP OmniLytics
Before reading on, we strongly suggest that you request a demo from our Client Success Specialist now and navigate the dashboards and charts with us.
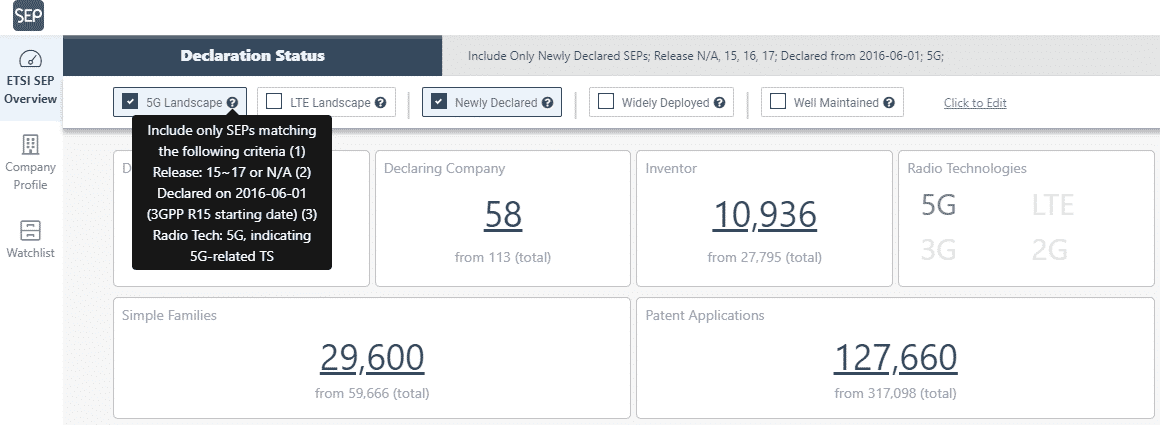
After accessing SEP OmniLytics, you will see the 5G landscape filter we have already set as the default for you. Enabling this option indicates that all of the charts are filtered for declarations and SEP data that meet the 5G definition. You can also learn more about a filter’s details by looking at the descriptions of each filter.
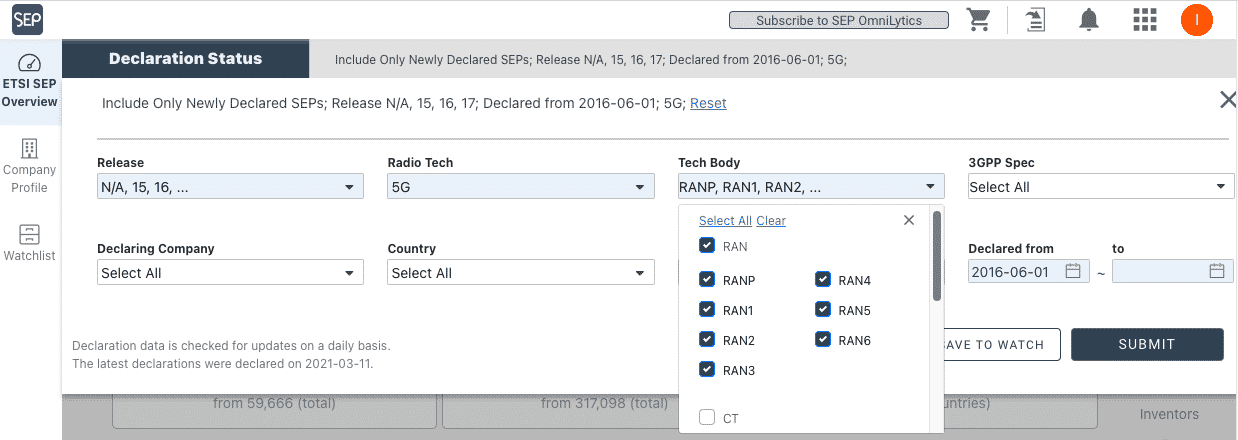
You can also use the advanced filters in the upper right corner of the screen to adjust the data scope. Interested in SEPs related to a specific 3GPP workgroup? Just click on the ones you want!
On the left side of the screen, you can also see the main tabs for the ETSI SEP Overview dashboard and Company Profile dashboard.
Now, let us take a look at the 5 crucial charts!
Chart 1. Top declarers — Who is leading the 5G SEP race?
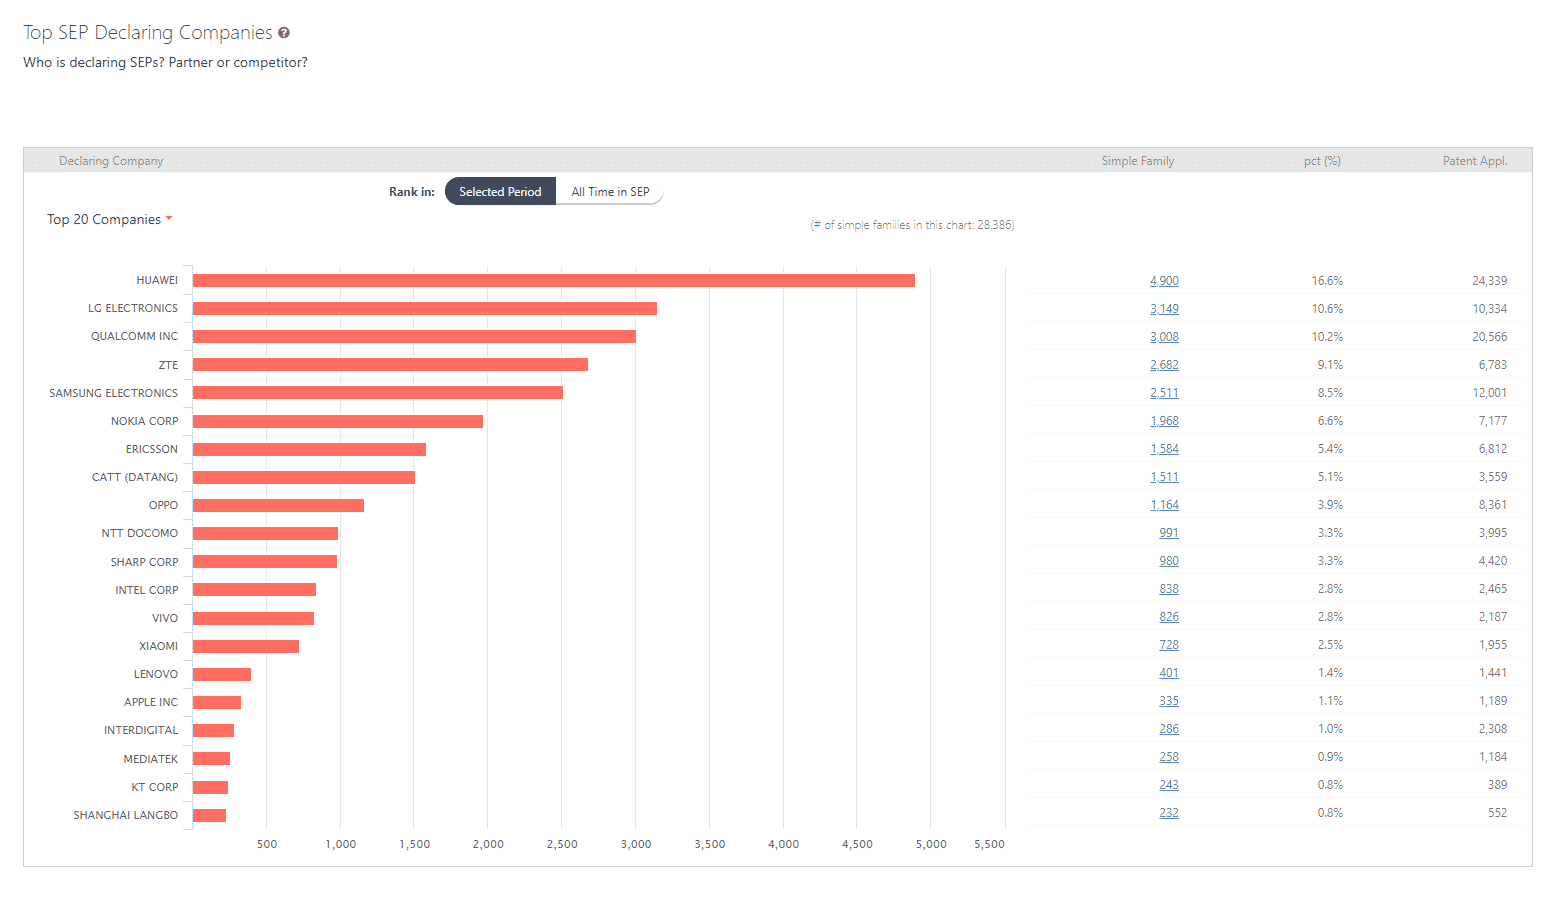
There has been a long dispute about which company is leading the 5G standard essential patent race. Is Huawei really out in front? Or are the old tech giants still ahead of the game? From this chart, you can get a glance at the overall situation in terms of declaration numbers.
Don’t forget the one-click and advanced filters you can use when viewing the overall declaration status.
Chart 2. Global coverage – Where and how are SEPs deployed?
As FRAND licensing rates are a central issue regarding SEPs, it is crucial to examine a companies’ global deployment status of its SEPs along with the legal statuses before and during licensing negotiations. The information in this chart allows for the examination of which target markets are covered by the SEPs and the validity of each market.
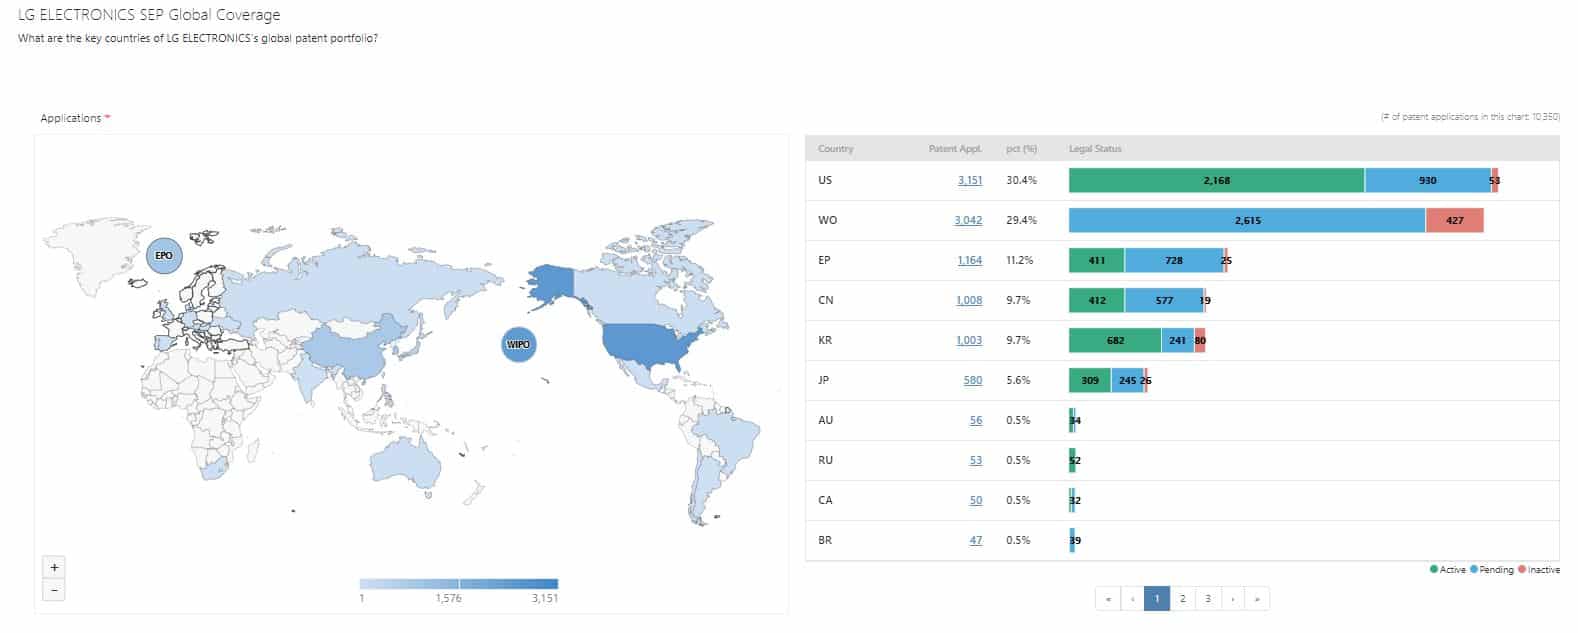
First, proceed to the Company Profile dashboard (on the left) and select a specific company. You can find the Global Coverage chart under the As a Current Owner tab. This chart shows the number of patents a company has in each country and also provides a closer breakdown of their legal status. This information will be crucial whether you are performing a competitor analysis or negotiating a license agreement, especially when discussing either a global licensing rate or a regional licensing rate.
Patentcloud’s Data Science Team has put a great deal of effort into standardizing the company trees of SEP-related companies. This allows you to view the SEPs via groups and avoid the hassle of identifying subsidiary affiliations. (If you are interested, you can view the affiliates using the Affiliates button on the dashboard.)
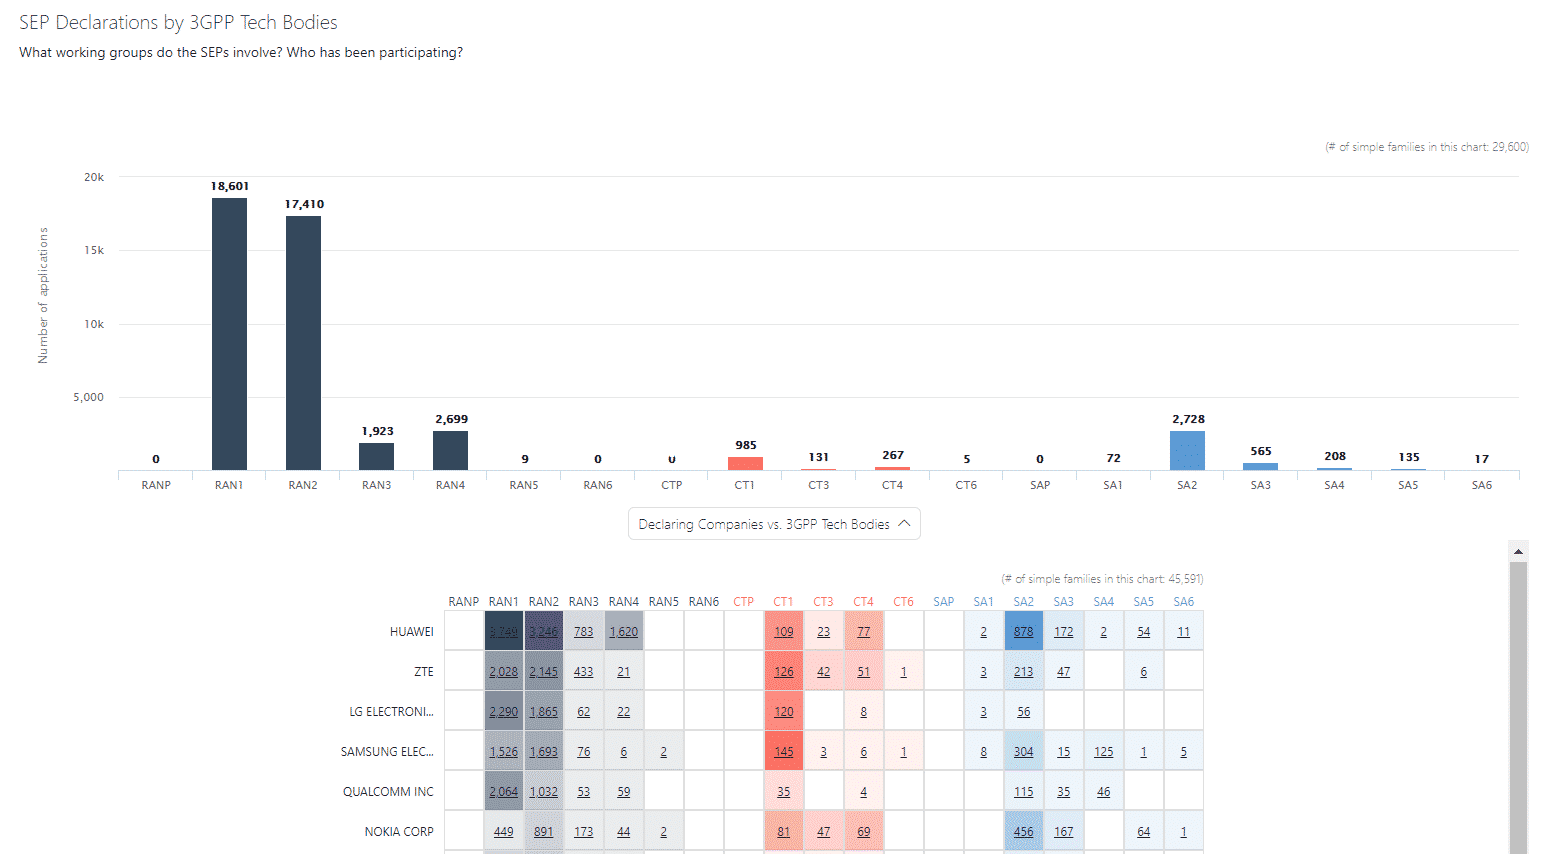
Chart 3. Working groups – Who has been declaring what?
In this chart, you can get an overview of declared SEPs’ technology distribution and the major application areas that each company is invested in.
For SEP owners, this information will aid in conducting competitor analysis. As an example, those in the cell site or antenna industry can look for competitors invested in the same RAN group.
As for implementers, potential licensors can be foreseen before they come knocking on your door.
If you are targeting a benchmark company, you can also access the same chart in the Company Profile dashboard. The example below illustrates how Qualcomm engaged in different tech bodies during the past few years and made contributions to different working groups.
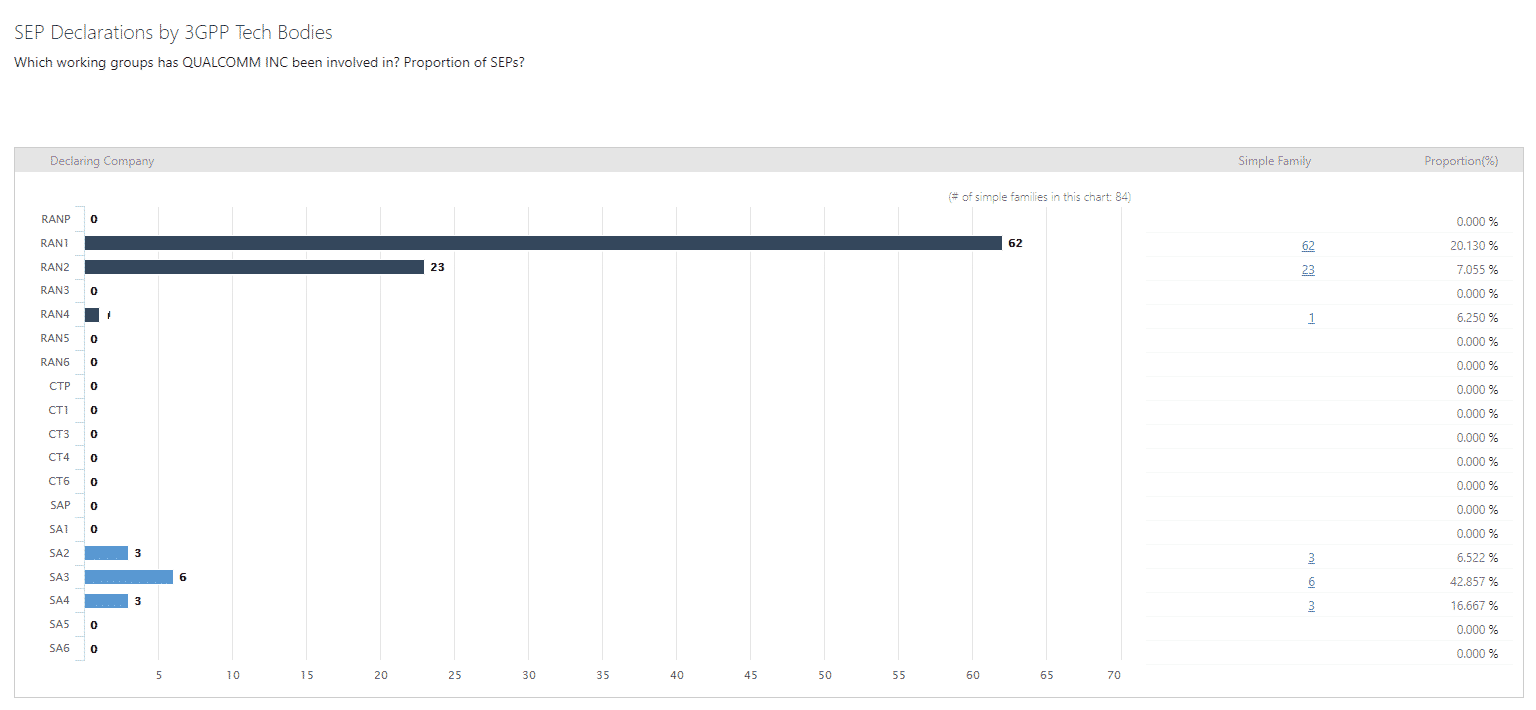
Chart 4. Remaining life – How sustainable is a SEP holder’s patent portfolio?
Looking even deeper, how do you determine the status of a company’s SEP portfolio? On the Company Profile dashboard, besides the Global Coverage or Legal Status charts, the Remaining Life chart allows you to inspect the sustainability of a company’s SEPs in each jurisdiction.
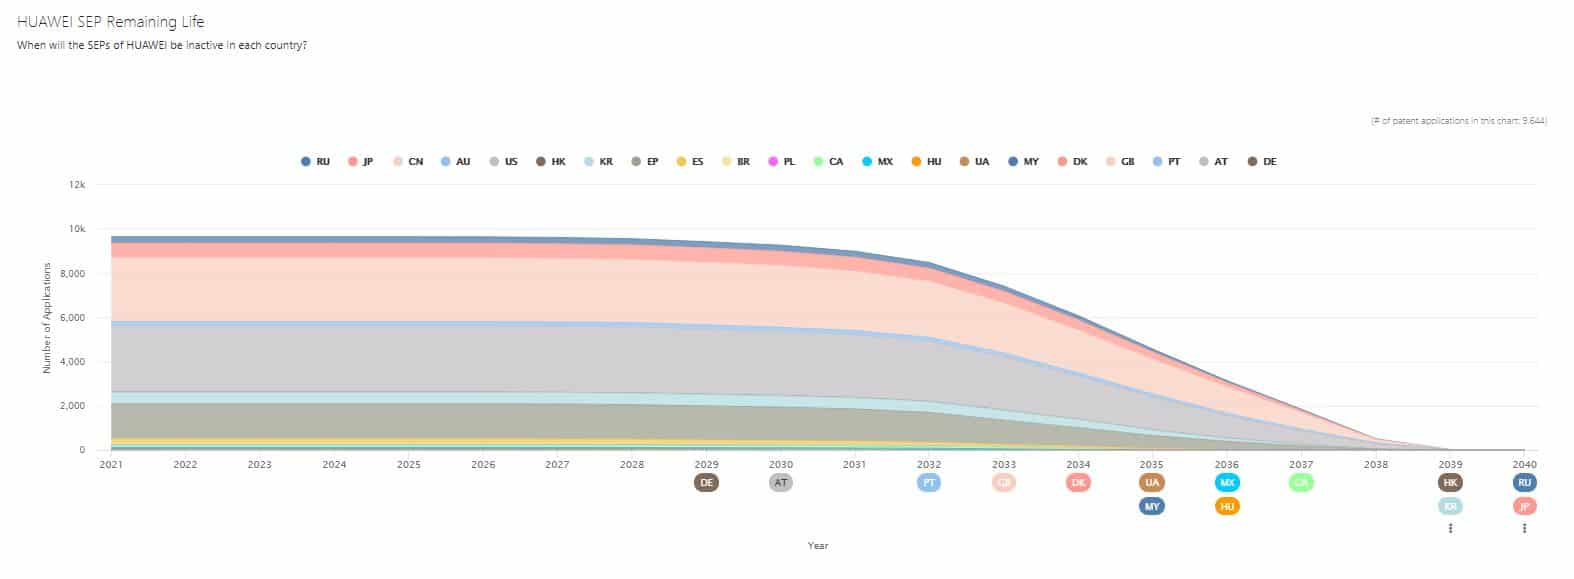
Chart 5. Technical specifications – Who are the specialized leaders in each technology?
Diving even deeper, SEP OmniLytics provides the technical specifications found in 3GPP standards for the declared standard essential patents. With this chart, you can explore the technical specifications in your field and dig out the SEPs they correlate with.
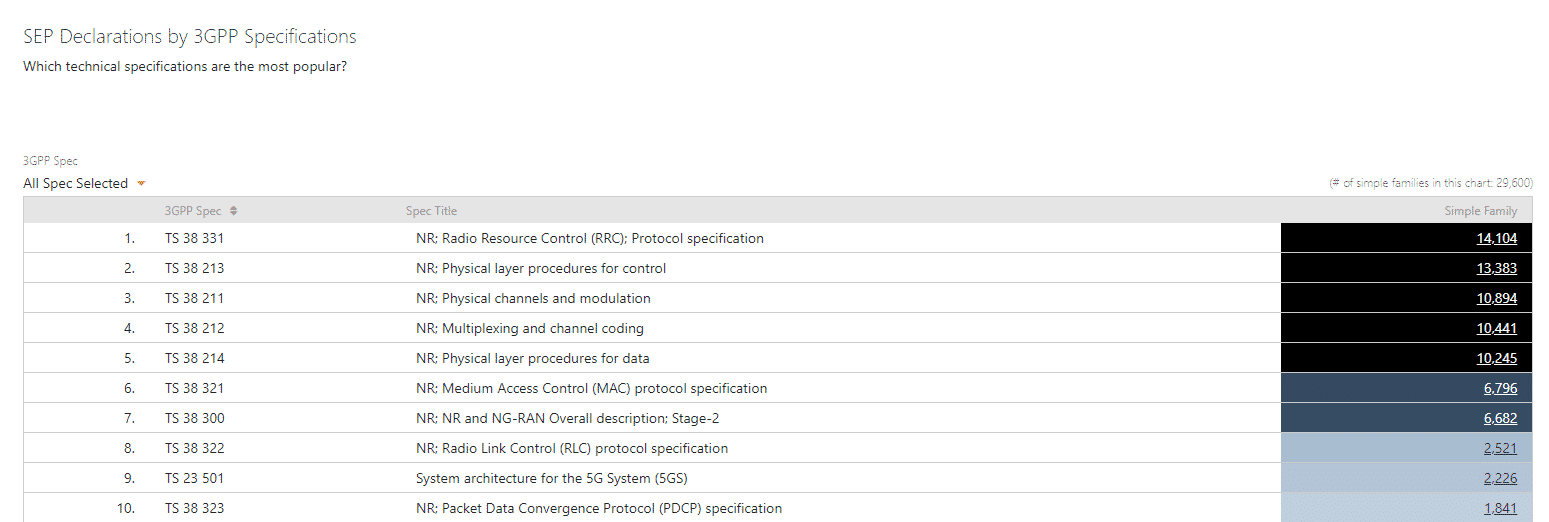
But, the application of this chart is truly highlighted when viewing it from the Company Profile dashboard. Let’s head over to look at the chart under the As a Declaring Company tab.
The most important function of this chart is to extract the most detailed SEP technology segments. The list of patents extracted here is valuable for competitor research, licensing risk evaluation, and industry research in more specific industries such as those in enterprise private networks or microcells.

SEP OmniLytics — Monitor the latest ETSI SEP declaring activity in real-time
We’re glad that you have made it this far and hope you’ve enjoyed these tips. With more and more features becoming available soon, there will be much more you can do with SEP OmniLytics — keep an eye on our blog and watch out for the latest news releases from InQuartik.
Click the button below to request a demo from our Client Success Specialist now and check out SEP OmniLytics yourself!


