The Japanese Patent Office (JPO) has recently released its “Japan Patent Office Status Report 2019.” This report takes a look back at this year’s challenges and achievements, as well as the Office’s plan for 2020. In specific, Chapter 1 analyzes in detail the main trends in domestic IP, utilizing as a reference the (now) complete data from 2018.
For your convenience, we have gone through the entire report and come up with our top ten takeaways in order to give you a concise—yet clear—picture of the Japanese patent industry.
1.313,567 patent applications were filed in 2018
International patent applications are on the rise.
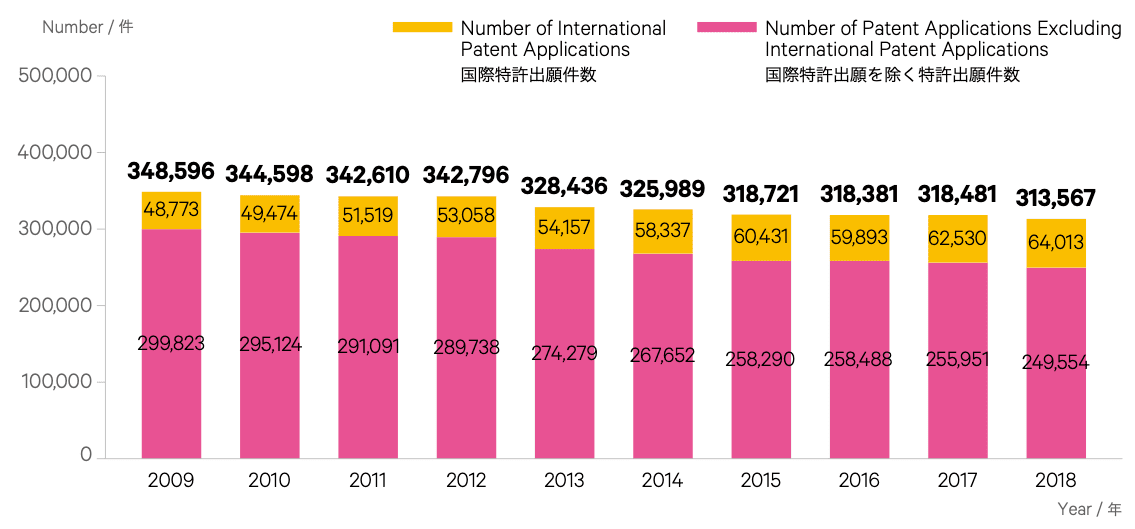
While the overall number of patent applications slightly decreased (-1.54%) compared to 2017 (when 318,481 applications were filed), the number of international patent applications rose from 62,530 to 64,013 (+2.37%). This seems to confirm the general trend that has been continuing for the past 10 years, which sees 1) the overall patent applications slightly decreasing on a year-to-year basis; 2) the international patent applications increasing at a similar pace. The only exceptions are 2012, when overall patent applications increased by 0.05%, and 2016, when international patent applications decreased by 0.89%.
2.Of these, 194,525 were granted
This is a slight decrease compared to 2017.
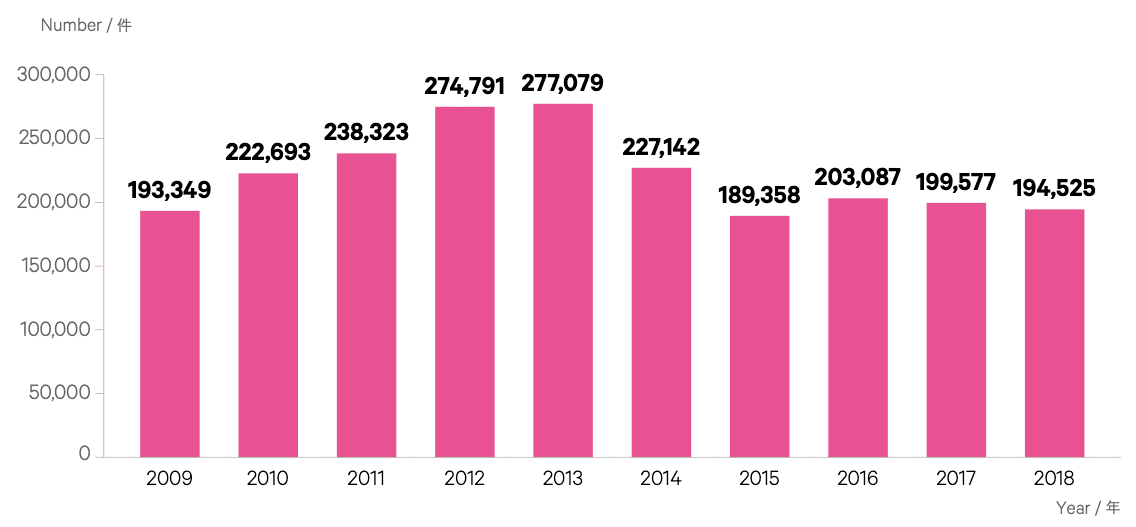
Overall, 62% of the applications were converted into patents in 2018. This slight decrease in granted patents reflected the aforementioned slight decrease in application filings in comparison to 2017, when about 5,000 more applications successfully passed the Japanese Patent Office’s scrutiny. After an uptrend curve that peaked in 2013 (with 277,079 grants), fewer patents are being granted every year. Last year’s application/grant ratio is the third lowest in the past 10 years, after 2015 (59%) and 2009 (55%).
3.US applicants came after Japan in terms of major patent application filers
Germany, China, and South Korea followed behind Japan and the US.

Japanese entities filed a total of 253,637 applications in 2018, while the US closed the year far behind in second position with 23,136 filings. Japan’s top position is—unsurprisingly—due to domestic applications (228,485), with the US (3,775), South Korea (2,119), China (1,487), and Taiwan (1,124) completing the Top 5 for domestic applications. Japan took the top spot in international patent applications as well (24,932 filings), followed again by the US (14,423), and Germany (4,556). As for applications in a foreign language, the top position was taken by the US with 4,938 applications.
4.Mitsubishi, Canon, and Toyota had the highest number of domestic patent grants
This Top 3 hasn’t changed from the previous year.
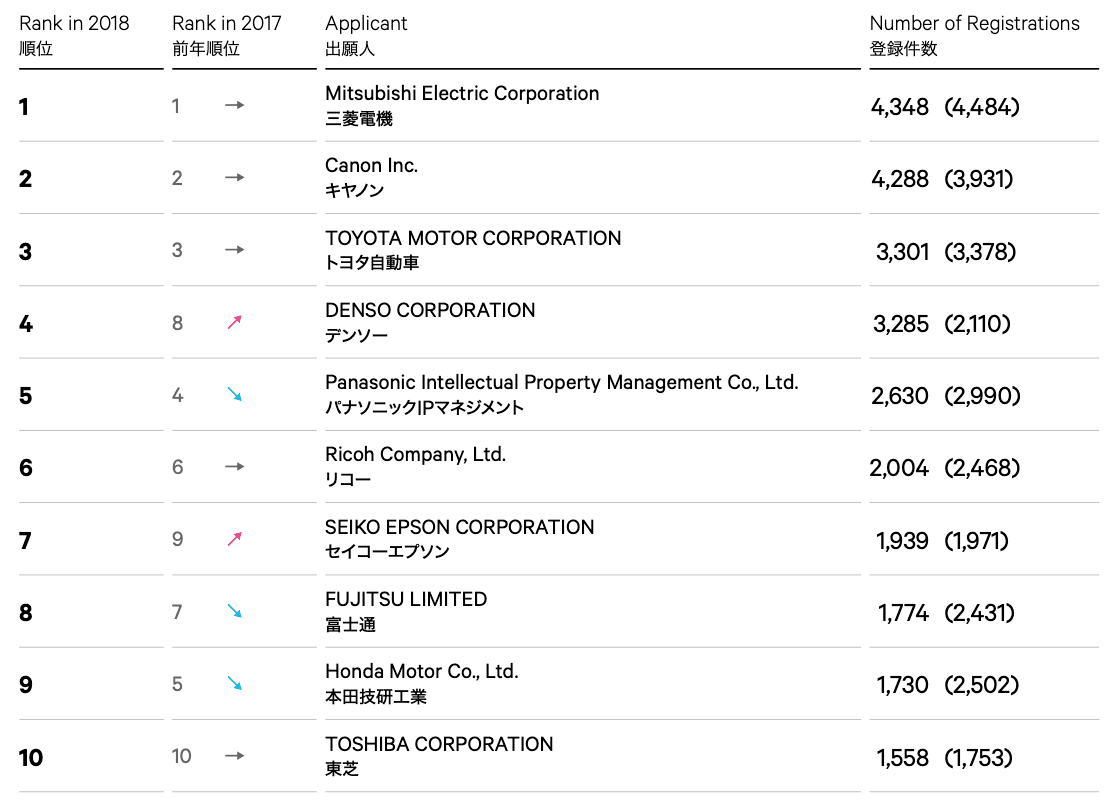
Returning to domestic applications, 2018 saw an unchanged Top 3 from 2017 with Mitsubishi, Canon, and Toyota receiving a total of 11,937 granted patents, approximately 44% of the entire Top 10. The biggest jumps in the rankings were made by Denso (a positive one, from the eighth to fourth position) and Honda (a negative one, from fifth to ninth position). The rest of the chart brought no surprises, with Ricoh and Toshiba keeping their positions (respectively sixth and tenth).
5.Huawei entered the Top 3 foreign applicant list, joining Qualcomm and Philips
General Electric—number three in 2017—ended up in sixth position following LG and Samsung.
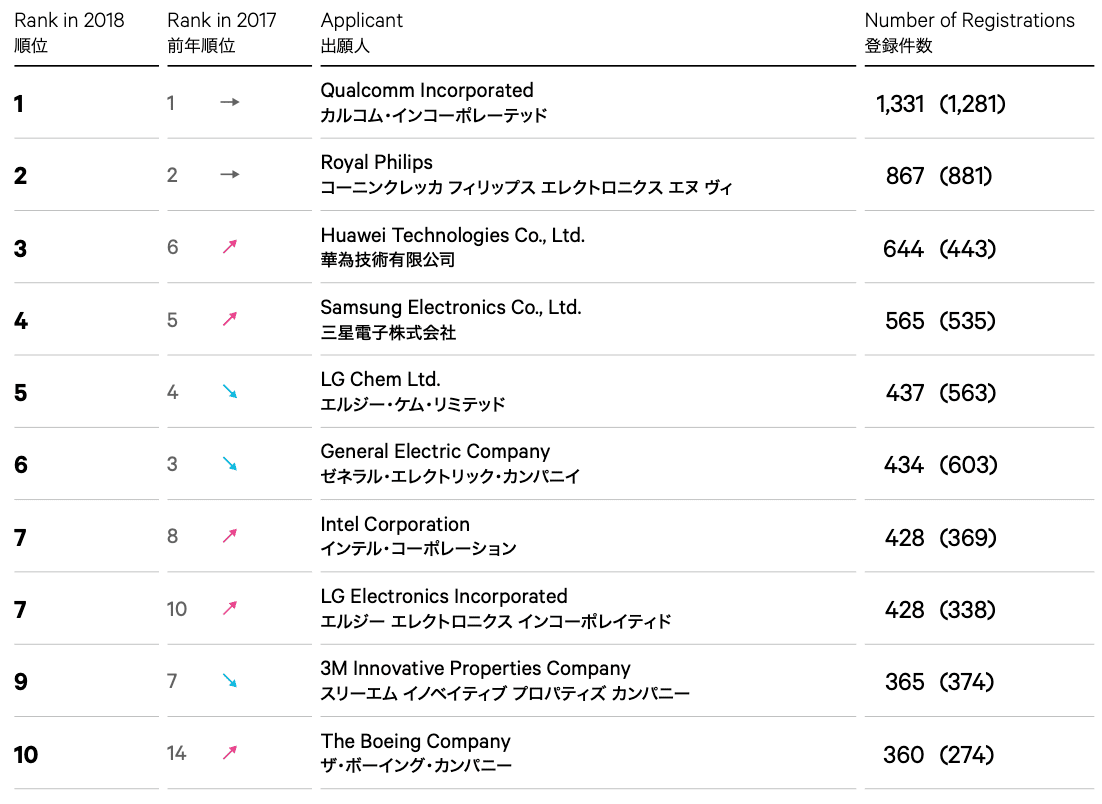
As for foreign companies, the entire ranking was reshaped in comparison to 2017, with Qualcomm (first position) and Philips (second position) being the only exceptions. Huawei entered the Top 3 from the sixth position, taking the place of General Electric. The companies in the Top 3 (Qualcomm, Philips, and Huawei) had a grand total of 2,842 granted patents, which was about 49% of the whole Top 10. Big positive jumps were also made by LG (from tenth to seventh) and Boeing (from fourteenth to tenth).
6.Patent applications filed by universities remain steady
The University of Tokyo’s leading position in academic patenting remained unchanged.
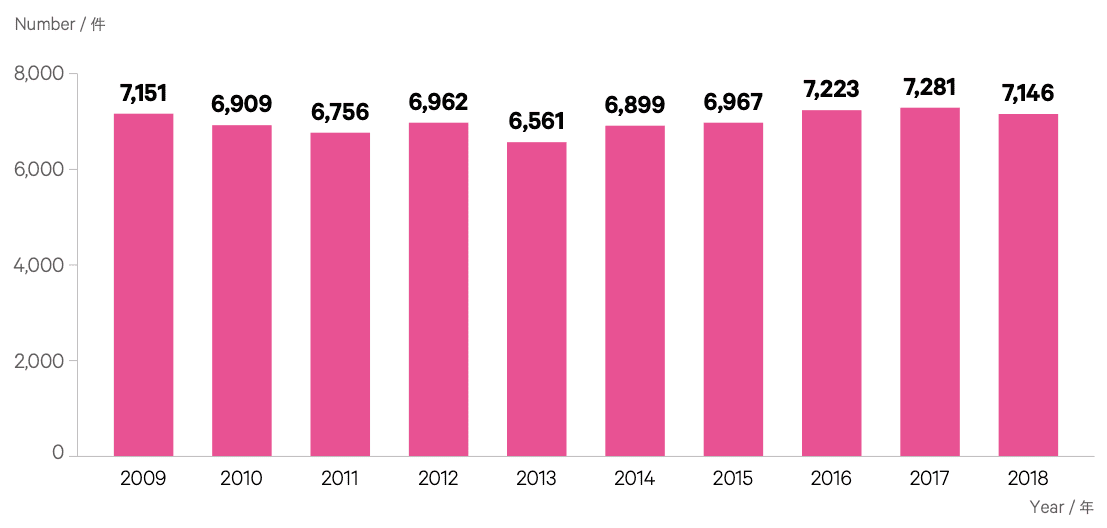
Applications filed by universities (including those jointly submitted with corporations) reached 7,146. Even with fewer applications (259 in 2018 vs. 284 in 2017), the University of Tokyo retained its leading position in academic patenting. Osaka University, which jumped from third to second position, increased its patenting efforts with more than 50 applications in comparison to 2017. On the other hand, Tohoku University applied for 42 fewer patents, causing it to end up in third place. New entrants to the Top 10 are Keio University (73 filings) and Shinshu University (66 filings).
7.The number of PCT applications is on the uptrend
This share has increased by about 66% between 2009 and 2018.

Except for 2014 (in which there was a decrease of 4.1%), PCT international applications filed with the JPO as the receiving office have been increasing consistently over the last 10 years, going from 29,291 in 2009 to 48,630 in 2018.
8.Efficiency during examination is one of JPO’s priorities
Initiatives to speed up examinations and accelerated schemes are setting JPO apart from other patent offices.
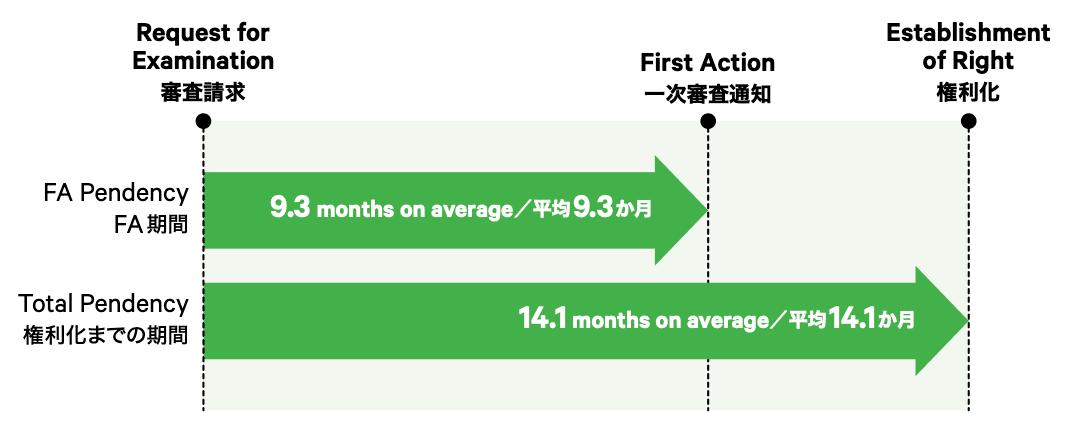
With an average of 14.1 months, Japan’s total patent pendency is the lowest among the IP5 patent offices. The performance of the other members is as follows: Korea—15.9 months; China—22 months; US—24.2 months; and Europe—24.9 months.
To achieve such results, the JPO introduced a number of initiatives to speed up the examination process, and especially to reduce the time needed to produce the first Office Action.
One of these initiatives is to make sure that the office can run smoothly with a proper number of patent examiners at work. For 2018, the number of patent examiners (including those under fixed-term contract) was 1,690.
To further expand the office’s examination capacity, 10 registered search organization were entrusted with performing prior art searches. Last year, the applications processed by these external offices amounted to approximately 152,000.
Prior art searches were also sped up, with machine translation into Japanese of US, EP, and WIPO patent documents in English as well as the improvement of patent classification standards.
The main milestone in increasing the efficiency of the office is perhaps the introduction of the “Super-Accelerated Examination System”, which mainly targets applications for inventions that have already been put into practice. The ultimate goal of the program is to reduce the FA pendency to less than one month.
9.Customer’s satisfaction is increasingly important
Interview examinations are at the core of this process.
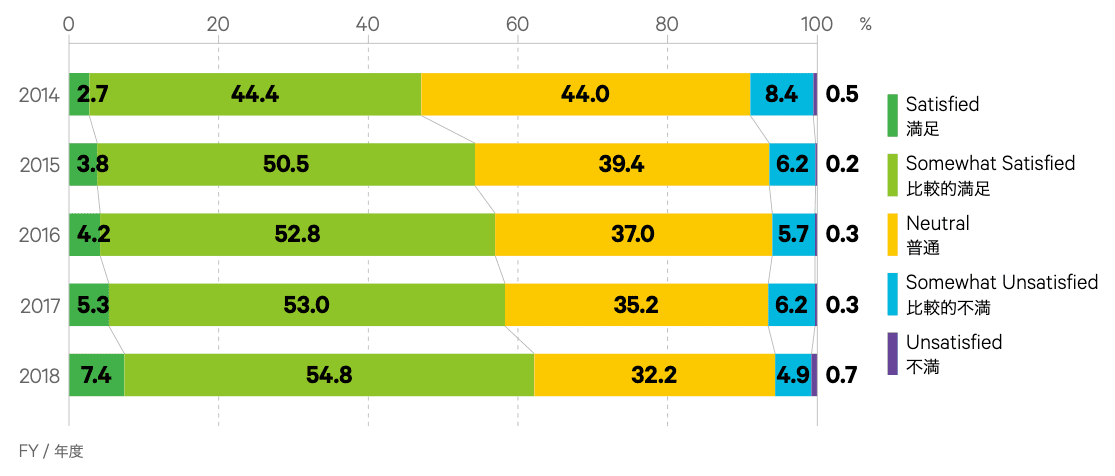
With an average of 94.4% satisfied users, the JPO hasn’t only been making speed its main commitment—quality has also been improved.
One of the office’s strong points is interview examinations, which have the main goal of facilitating communication between the parties involved in the examination process.
Last year, a total of 4,128 interview examinations were conducted; of these, 155 were conducted by video conference, allowing inventors and patent attorneys located in remote areas to participate.
10.Integration between patents, trademarks, and designs is the way forward
A coordinated examination for different types of IP can foster the achievement of business objectives.
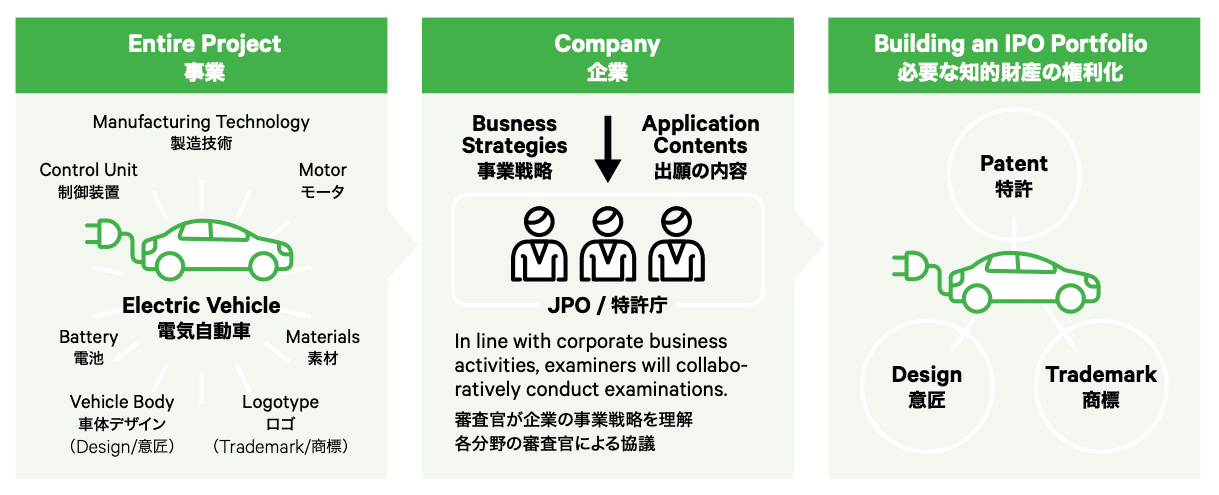
For those inventions that require more than one type of IP protection, the JPO has introduced the “Collective Examinations for IP Portfolio Supporting Business Strategy”. With this program, the examiners involved in different processes (for patents, design patents, and trademark protection) can work together and share information, decreasing the amount of time and resources that are wasted by performing the same action more than one time.
This type of approach to IP protection makes it easier for companies—mainly startups—to pursue business goals and develop highly integrated IP portfolios.
Bonus Takeaway: Most patents covered electric elements
The most patented technical fields at the JPO in 2018 were: 1) Electric elements; 2) Telecommunication technology; 3) Calculation, counting.
It is clear that the JPO is focussing on improving the speed and quality of its examination processes. Could the slight decrease in patent grants that we noticed at the beginning of the article not only be a consequence of fewer applications, but also a result of these improved practices? We might have a more definitive answer next year, with the publication of a new report. In the meantime, check out the other reports and takeaways we have published this year in order to get 2020 started in full swing.
The data and the charts above were sourced from the Japan Patent Office Status Report 2019.

